Thin Film Rupture
When two objects come together, the surrounding fluid (be it a gas or liquid) has to drain from the region between the objects. As the distance between the objects becomes small, this fluid region becomes thin - a 'thin film'. The objective of our research in this area is to predict how quickly a thin film can drain (or does it drain?), so that we can predict if and when the two colliding objects touch, or alternatively, how the thin film prevents impact and then what happens to the two colliding objects. The techniques that we have developed are efficient enough to be able to handle very thin films, while also accounting for inertial effects in the deforming droplets.
Two applications for this numerical technology are given here. The first is droplet coalescence, which has application to (for example) predicting how droplets behave in mineral process industries, in particular solvent extraction. The second is droplet rebound from hot surfaces, known as the dynamic Leidenfrost effect. Understanding this phenomenon is required to predict (for example) heat transfer from sprays used to extinguish fires, or cool process equipment.
Droplet Coalescence in the presence of surfactants
Abdul Raize Rasheed, Geoff Stevens and Dalton Harvie
Raize is performing a PhD on this topic, as part of an ARC funded Discovery Project 'Understanding Droplet Interactions in Solvent Extraction'.
Simulating Droplet Coalescence
Lachlan Mason, Peter Witt, Geoff Stevens and Dalton Harvie
Lachlan performed a PhD on this topic, supported by an Australian Postgraduate Award and CSIRO PhD scholarship.

Dynamic Leidenfrost
Dalton Harvie and David Fletcher
This work was funded by a Unversity of Sydney PhD scholarship.
This was the main topic of my PhD thesis (Dalton Harvie's) conducted in the late 1990s. The objective was to simulate the hydrodynamics and thermodynamics of a volatile droplet as it impacts upon a hot solid surface. The work was motivated by a series of large scale solid fuel fire extinguishment experiments that we were conducting: We were finding that the heat extracted by a typical water extinguishment spray was significantly less than expected. Close inspection showed that many of the impacting water droplets simply `bounced' off the burning surface, resulting in low heat transfer rates. By simulating the impacts I wanted to understand more about the physics of the process.
What is the Leidenfrost phenomenon?
The Leidenfrost phenomenon describes the way in which a volatile droplet becomes suspended above a hot surface, supported by a cushion of its own vaporising vapor.
If you deposit a small amount of water on to a hot (>240°C say) smooth frying pan you'll see static Leidenfrost droplets. Notice that as you tilt the pan the droplets move easily around, like a puck on an air hockey table. Also notice that the droplets take a long time to evaporate: The cushion of steam that is created between the droplet and the pan not only provides an excellent lubrication layer, but also a good insulating layer, limiting the evaporation rate of the liquid.
A static Leidenfrost droplet is also known as a film boiling droplet.
What is a dynamic Leidenfrost impact?
A dynamic Leidenfrost impact (or film boiling impact) describes a volatile droplet that approaches a hot solid surface, but is forced away from that solid without touching due to the formation of a vapor lubrication layer. The steps are:
- Droplet approaches solid surface.
- Heat is transferred to lower surface of droplet via conduction and radiation.
- Heat is used to increase liquid temperature, and to vaporise liquid.
- Vapour is forced out from between the liquid and solid.
- Viscous forces within the vapour flow increase the pressure beneath droplet.
- Pressure causes an upward directed force on droplet.
- Whether the droplet touches the solid and its subsequent behaviour determines the thermodynamic impact regime.
Overview of the numerical method
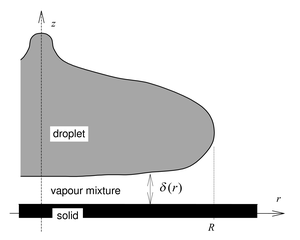
To simulate the process two separate fluid dynamics algorithms were coupled:
- Internal droplet dynamics Volume of Fluid (VOF) CFD code (2D)
- Viscous vapour layer code (1D)
The coupling between codes was `two-way' via:
- Pressure at the lower surface of the droplet
- Position, velocity and geometry of the lower surface of the droplet
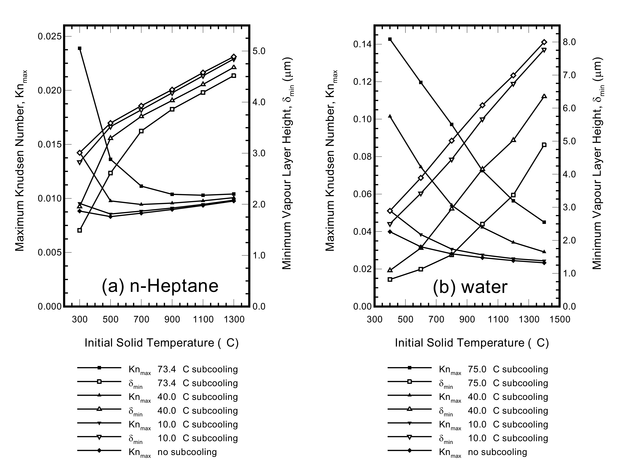
Heat transfer within all three phases (solid, vapour layer and liquid) was solved, as was a mass transport equation to determine the droplet vapour/air mix within the vapour layer. Kinetic theory `slip' treatments were used at both the solid/vapour and liquid/vapour boundaries to represent non-continuum effects within the gas. More details can be found in the publications.
Results: Droplets initially at their boiling point
The behaviour of droplets that are initially at their boiling point (or saturation temperature; for example 100°C for water at atmospheric pressure) is quite different to those that are initially subcooled (room temperature for water for example).
The speed at which the droplet travels at prior to impacting with the surface also significantly affects their 'rebound' behaviour. This speed can be expressed nondimensionally via the Weber number,

Simulations of droplets initially at their saturation point and impacting upon high thermal conductivity surfaces were compared against published experiment data. At low Weber numbers (<30 say), the correspondance between simulation and experimental results is good.
The animation (right) shows a We=15 impact based on experiments reported by Wachters and Westerling (Chemical Engineering Science, 21:1047-1056, 1966). Notice that during the initial spreading phase a large 'envelope' of vapour is generated under the droplet. Any heat that is transferred to the droplet during this time has to conduct through this layer; hence, this layer insulates the droplet from the hot solid surface. Later, as the droplet begins to recoil, the base of the droplet comes very close to the solid again several times. Significant heat transfer occurs during this recoil phase.
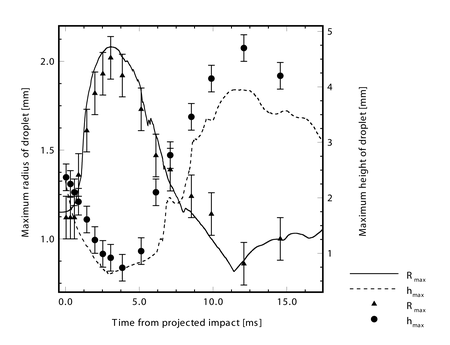
A comparison of the predicted and experimentally measured droplet radius and height during the impact shows that the model predicts the oscillation of the droplet quite well, although the height of the droplet is underpredicted somewhat at later times. As observed by Wachters and Westerling, typically the residence time of an impacting Leidenfrost droplet on a surface will be roughly the same as the natural oscilation period for the droplet,

As the Weber number becomes larger (that is, higher impact velocities) the droplets typically form some type of asymmetrical shape during the impact (for example, breakup or a oscillating mass). As the simulations are based on a two dimensional cylindrical coordinate system, this type of behaviour cannot be predicted. Generally for 30<We<80 the model predicts at least the first expanding stage of an impact, but not the recoil and rebound stage. For We>80 the droplets typically breakup as they are expanding, hence the model is not able to capture the hydrodynamic behaviour of these droplets.
The simulation (below) is based on experiments reported by Groendes and Mesler (Proc. 7th Int. Heat Transfer Conf., Munich, 131-136, 1982) and has We=68. Comparison against the experimental results shows that the hydrodynamic aspects of the simulation are accurate until about 10ms from projected impact. At times beyond this the simulation shows the formation of large toroids of fluid that expand radially outwards (so converting the kinetic energy at impact to potential surface energy). In reality these toroids would be unstable to breakup in the azimuthal (circumferential) direction. The experiments show that by around 15ms the real droplet has formed a large asymmetrical oscillating mass of fluid.
Groendes and Mesler also measured the surface temperature of the quartz solid during the impact using a fine gauge thermocouple. Quartz was used for the solid as it has a low thermal conductivity and will consequently show a large temperature decrease for a given heat loss rate. Experimental results measured by the thermocouple, along with interface temperatures at both the liquid/vapour and solid/vapour interfaces predicted by the simulation are shown below. The simulation results are for temperatures at the centreline of the geometry.
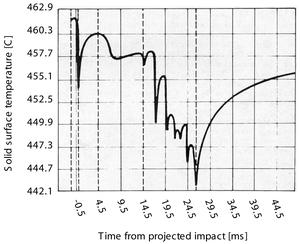
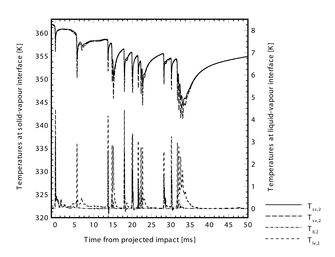
Both the experimental and simulation solid surface temperatures show downward pointing `spikes' at times when the droplet interface is in close proximity to the solid. This is because when the distance between the solid and liquid interface is lowest, the heat transfer rate from the solid to the liquid is highest. The first spike occurs around t=0ms when the droplet first approaches the solid. As the envelop of vapour is formed under the droplet after its initial impact, the heat transfer rate from the solid decreases and the solid surface temperature rises again.
The simulation results (and to a lesser extent the experimental results) show a second temperature depression occurring around 6ms. As is evident in the animation (above) at this time the main body of the droplet has spread radially over the solid and is being rapidly decelerated in the axial direction: Hence, the lower droplet surface is being forced towards the solid for a second time and this causes high heat transfer rates. The experimental temperature depression at 6ms is not as pronounced as predicted by the simulations - this may be because the experimental droplet did not impact precisely above the embedded thermocouple, or possibly that the underside of the experimental droplet has already become asymmetrical at this time.
Beyond 15ms both the simulations and experiments show that rapid solid surface temperature spikes occur until around 30ms, at which time the solid temperature begins to increase again. Hydrodynamically the rapid spikes correspond to a series of rapid `impacts' that occur between the lower droplet surface and the solid as surface tension pulls (reforms) the main body of the droplet inwards, thus forcing its lower central surface downwards. Beyond 30ms the main droplet mass leaves the vicinity of the solid (rebounds), allowing the centreline solid surface temperature to increase. Interestingly, despite the asymmetrical hydrodynamic behaviour of the droplet not being predicted by the simulation beyond the initial impact and expansion phase, the thermodynamic behaviour of the liquid/vapour/solid system near the centreline is captured by the simulations at these later times (at least in a qualitative sense).
The simulation results also show that some superheating of the liquid at the liquid/vapour interface occurs during the impact, however the amount is generally small. More significantly, at times there are temperature differences across the vapour/liquid interface of a few degrees. These differences are due to non-continuum `slip' effects that occur over a volatile interface, included in the simulations via a kinetic theory model.
Results: Subcooled droplets (initial temperature below their boiling point)
Subcooled droplets behave quite differently to those initially at their boiling point. In a subcooled impact a considerable proportion of the heat that conducts across the thin vapour layer is convected into the droplet during the impact, rather than just being used to vaporise liquid. As the amount of vapour generated during the impact is less, a subcooled droplet generally remains much closer to the solid during the impact, and no large envelope of vapour is formed at its lower surface (as in the saturated impact case). This has the secondary effect of increasing the heat transfer rate from the solid, meaning that subcooled droplets are significantly more effective at cooling the solid than saturated droplet impacts.
The simulation (right) is based on an experiment presented in Qiao and Chandra (1996, Int. J. Heat Mass Trans., 39, p1379). In the experiment a n-heptane droplet initially at room temperature (approximately 75°C subcooling) impacts upon a 210°C solid in a low gravity environment. For this impact We=32. Comparison shows that the simulations capture the hydrodynamic behaviour of the experiment accurately.
What causes vapour layer collapse?
There are more questions here than answers. A BYO stipend PhD topic is suggested to study this problem - see Positions.
As subcooled droplets come closer to the solid during an impact than saturated droplets, they are more likely to touch the solid during the impact, resulting in destabilisation of the vapour layer and subsequent nucleate or pool boiling (with substantially higher heat transfer rates). As an illustration, a water droplet initially at 100°C will film boil impact at around 240°C solid temperature, however a water droplet initially at 25°C will not film boil impact even at much higher solid temperatures.
What is particularly interesting is what is happening within the vapour layer as the layer begins to collapse. Using the numerical model these conditions can be examined.

